
Page 107 - Gondwana Collection Namibia Value Creation Report 2021
P. 107
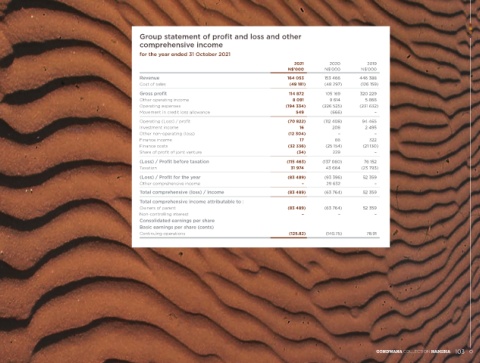
SUMMARISED ANNUAL FINANCIAL STATEMENTS


 Group statement of financial position                 Group statement of profit and loss and other
 as at 31 October 2021                                 comprehensive income

  2021   2020   2019                                   for the year ended 31 October 2021
 N$’000  N$’000  N$’000
                                                                                                                    2021         2020           2019
 Assets                                                                                                          N$’000         N$’000        N$’000
 Non-current assets                                    Revenue
 Property, plant and equipment   801 267    811 686    746 455                                                    164 053       153 466       446 388
 Right of use asset  13 592   11 465    –              Cost of sales                                              (49 181)      (48 297)      (126 159)
 Intangible assets   26 436    27 153    27 879        Gross profit                                               114 872       105 169       320 229
 Goodwill  11 745   24 049    24 049                                                                                8 091
 Other financial assets   1    1    1                  Other operating income                                                     9 614         5 868
 Investment in joint venture   7 005    6 979    –     Operating expenses                                        (194 334)     (226 525)      (231 632)
 Loans to related parties  822  762  –                 Movement in credit loss allowance                             549          (666)            –
 Deferred tax asset   64 419    33 411    701
                                                       Operating (Loss) / profit                                  (70 822)      (112 408)      94 465
 925 287  915 506   799 085                            Investment income                                              16           208          2 495
 Current assets                                        Other non-operating (loss)                                 (12 304)           –             –
 Loans to related parties  –  –   762                  Finance income                                                 17            66           322
 Current tax receivables   1 886    2 504    6 196     Finance costs                                              (32 336)      (25 154)       (21 130)
 Inventories   15 040    15 603    17 026              Share of profit of joint venture                              (34)          229             –
 Biological assets   217    226    312
 Trade and other receivables   18 238    18 824    45 452   (Loss) / Profit before taxation                      (115 463)     (137 060)       76 152
 Cash and cash equivalents   9 930    6 563    16 951   Taxation                                                   31 974        43 664       (23 793)
 45 311  43 720   86 699                               (Loss) / Profit for the year                               (83 489)      (93 396)       52 359
 Total assets  970 598   959 226    885 784            Other comprehensive income                                      –         29 632             –
 Equity and liabilities                                Total comprehensive (loss) / income                        (83 489)      (63 764)       52 359
 Capital and reserves
 Share capital   66    66    66                        Total comprehensive income attributable to :
 Share premium   132 301    132 301    132 301         Owners of parent                                           (83 489)      (63 764)       52 359
 Revaluation reserve   200 880    200 934    171 354   Non-controlling interest                                        –             –              –
 Shareholders’ reserve   17 365    17 365    17 365    Consolidated earnings per share
 Retained earnings  33 838   117 273    210 616        Basic earnings per share (cents)
 384 450   467 939    531 702                          Continuing operations                                      (125.82)      (140.75)        78.91
 Long-term liabilities
 Interest bearing liabilities – secured   306 550    312 682    176 744
 Interest bearing liabilities – unsecured   603    514    354
 Lease liabilities  13 969   11 369   –
 Deferred interest Liability   2 089   –  –
 Deferred tax liability   39 755    40 736    52 083
 362 966   365 301    229 181
 Current liabilities
 Bank overdrafts   125 874    56 756    353
 Short-term portion of interest bearing liabilities – secured   34 726    23 003    41 738
 Short-term portion of interest bearing liabilities – unsecured   427    433    795
 Short-term portion of lease liabilities   503    545    –
 Current tax payable   11    696    6 942
 Trade and other payables   61 457    43 647    73 347
 Dividend payable   184    906    1 726
  223 182    125 986    124 901
 Total equity and liabilities   970 598   959 226    885 784

 102  VALUE CREATION REPORT 2021                                                                                                                    GONDWANA COLLECTION NAMIBIA 103