Page 98 - Gondwana Value Creation Report 2020
P. 98

SUMMARISED ANNUAL FINANCIAL STATEMENTS
        SUMMARISED ANNUAL FINANCIAL STATEMENTS


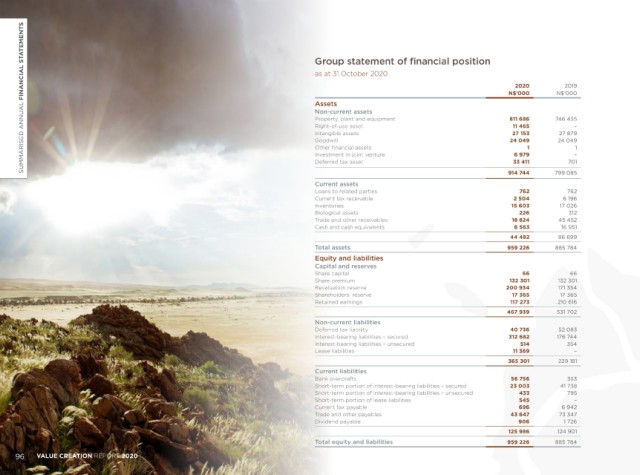
                                                                                               Group statement of financial position                                                                             Group statement of profit or loss and other

                                                                                               as at 31 October 2020                                                                                             comprehensive income
                                                                                                                                                           2020           2019                                   for the year ended 31 October 2020
                                                                                                                                                         N$’000        N$’000
                                                                                                                                                                                                                                                                             2020           2019
                                                                                               Assets                                                                                                                                                                      N$’000        N$’000
                                                                                               Non-current assets                                                                                                Revenue
                                                                                               Property, plant and equipment                              811 686      746 455                                                                                             153 466       446 388
                                                                                               Right-of-use asset                                          11 465           –                                    Cost of sales                                             (48 297)      (126 159)
                                                                                               Intangible assets                                          27 153        27 879                                   Gross profit                                              105 169       320 229
                                                                                               Goodwill                                                   24 049        24 049                                                                                               9 614         5 868
                                                                                               Other financial assets                                          1             1                                   Other operating income
                                                                                               Investment in joint venture                                6 979             –                                    Operating expenses                                       (226 525)      (231 632)
                                                                                               Deferred tax asset                                          33 411          701                                   Movement in credit loss allowance                           (666)             –
                                                                                                                                                         914 744       799 085                                   Operating (loss)/profit                                  (112 408)       94 465
                                                                                                                                                                                                                 Investment income                                            208          2 495
                                                                                               Current assets
                                                                                               Loans to related parties                                      762           762                                   Finance income                                                66           322
                                                                                               Current tax receivable                                      2 504          6 196                                  Finance costs                                              (25 154)       (21 130)
                                                                                               Inventories                                                15 603         17 026                                  Share of profit of joint venture                             229              –
                                                                                               Biological assets                                             226           312                                   (Loss)/profit before taxation
                                                                                               Trade and other receivables                                18 824        45 452                                                                                            (137 060)       76 152
                                                                                               Cash and cash equivalents                                   6 563         16 951                                  Taxation                                                  43 664        (23 793)
                                                                                                                                                          44 482        86 699                                   (Loss)/profit for the year                                (93 396)       52 359
                                                                                               Total assets                                              959 226       885 784                                   Other comprehensive income                                 29 632             –
                                                                                               Equity and liabilities                                                                                            Total comprehensive (loss)/income                         (63 764)       52 359
                                                                                               Capital and reserves                                                                                              Total comprehensive (loss)/income attributable to:
                                                                                               Share capital                                                 66             66
                                                                                               Share premium                                              132 301       132 301                                  Owners of parent                                          (63 764)       52 359
                                                                                               Revaluation reserve                                       200 934        171 354                                  Non-controlling interest                                       –              –
                                                                                               Shareholders’ reserve                                      17 365         17 365                                  Consolidated earnings per share
                                                                                               Retained earnings                                          117 273       210 616                                  Basic earnings per share (cents)
                                                                                                                                                        467 939         531 702                                  Continuing operations                                     (140.75)        78.91
                                                                                               Non-current liabilities
                                                                                               Deferred tax liability                                     40 736        52 083
                                                                                               Interest-bearing liabilities – secured                    312 682        176 744
                                                                                               Interest-bearing liabilities – unsecured                      514           354
                                                                                               Lease liabilities                                           11 369           –
                                                                                                                                                         365 301        229 181
                                                                                               Current liabilities
                                                                                               Bank overdrafts                                            56 756           353
                                                                                               Short-term portion of interest-bearing liabilities – secured   23 003     41 738
                                                                                               Short-term portion of interest-bearing liabilities – unsecured  433         795
                                                                                               Short-term portion of lease liabilities                      545             –
                                                                                               Current tax payable                                          696          6 942
                                                                                               Trade and other payables                                   43 647        73 347
                                                                                               Dividend payable                                             906           1 726
                                                                                                                                                         125 986        124 901
                                                                                               Total equity and liabilities                              959 226       885 784
      96    VALUE CREATION REPORT 2020                                                                                                                                                                                                                                                                                                            GONDWANA COLLECTION NAMIBIA          97
   93   94   95   96   97   98   99   100   101   102   103