
Page 76 - Gondwana Value Creation Report 2020
P. 76
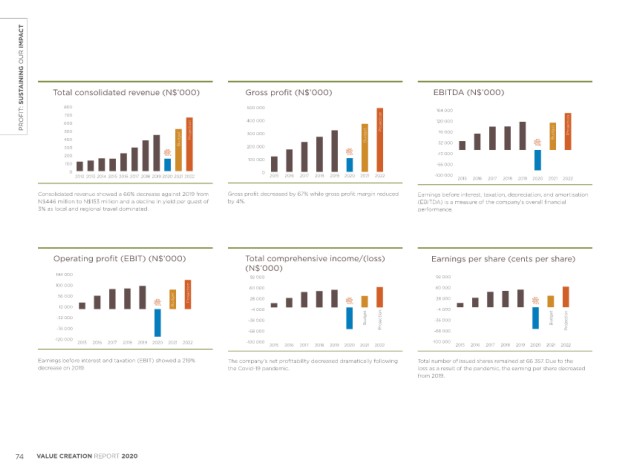
PROFIT: SUSTAINING OUR IMPACT Total consolidated revenue (N$’000) Gross profit (N$’000) EBITDA (N$’000) Without money, conservation is just conversation. 2019 2018 2017 (restated)
Group statement of profit and loss and other comprehensive income
As at 31 October
EBITDA (N$’000)
2016
2021
Total consolidated revenue (N$’000)
Gross profit (N$’000)
Budget
2020
800
500 000
800
500 000
N$’000
%
%
%
%
%
N$’000
N$’000
N$’000
700
164 000
700
600
211
164
80
226
225
120 000
17
223
190
400 000
120 000
600
500
300 000
(66)
17
291 870
219 549
Revenue
76 000
500
76 000
400 Budget Projection Projection 400 000 Budget Budget Projection Projection 164 000 Budget Budget Projection Projection Guests (’000) 520 558 239 153 466 (64) 446 388 (0.4) 380 408 30 1 N$’000 33 N$’000
300 000
400 Budget 200 000 32 000 Cost of sales (150 477) 212 (48 297) (62) (126 159) 14 (110 386) 78 (62 083) 33 (46 567)
300
32 000
300 200 000 Gross profit 370 081 252 105 169 (67) 320 229 19 270 022 18 229 787 33 172 982
200
-12 000
200 100 000 -12 000 Gross profit (%) 71 4 69 (4) 72 1 71 (10) 79 – 79
100
100 000
100 0 0 -56 000 Other income 2 384 (75) 9 614 64 5 868 59 3 693 (34) 5 597 114 2 613
-56 000
0 2012 2013 2014 2015 2016 2017 2018 2019 2020 2021 2022 0 2015 2016 2017 2018 2019 2020 2021 2022 -100 000
2012 2013 2014 2015 2016 2017 2018 2019 2020 2021 2022 2015 2016 2017 2018 2019 2020 2021 2022 -100 000 2015 2016 2017 2018 2019 2020 2021 2022 372 465 224 114 783 (65) 326 097 19 273 715 16 235 384 34 175 595
2017
2015
2016
2018
2021
2022
2019
2020
Operating expenditure (261 648) 33 (197 307) (7) (211 568) 19 (177 626) 27 (140 229) 28 (109 322)
Consolidated revenue showed a 66% decrease against 2019 from Gross profit decreased by 67% while gross profit margin reduced Earnings before interest, taxation, depreciation, and amortisation – – (666) – – – – – – – –
N$446 million to N$153 million and a decline in yield per guest of by 4%. (EBITDA) is a measure of the company’s overall financial Movement in credit loss allowance
3% as local and regional travel dominated. performance. EBITDA 110 817 (233) (83 190) (173) 114 529 19 96 089 1 95 155 44 66 273
EBITDA (%) 21 (139) (54) (311) 26 2 25 (23) 33 8 30
Operating expenditure – depreciation (31 400) 7 (29 219) 46 (20 064) 70 (11 802) (11) (13 335) 19 (11 220)
Operating profit/(loss) (EBIT) 79 417 (171) (112 408) (219) 94 465 12 84 287 3 81 820 49 55 054
Investment income 20 (90) 208 (92) 2 495 92 1 297 – –
Net finance cost (29 317) 17 (25 088) 21 (20 808) 45 (14 368) 3 (13 920) (2) (14 228)
Operating profit (EBIT) (N$’000) Total comprehensive income/(loss) Earnings per share (cents per share) Share of profit of joint venture – – 229 – – – – – – – –
Operating profit (EBIT) (N$’000)
92 000
144 000 (N$’000) Earnings per share (cents per share)
144 000 Profit/(loss) before taxation 50 120 (137) (137 060) (280) 76 152 7 71 216 5 67 900 66 40 826
92 000
92 000 60 000
100 000 Taxation (16 038) (137) 43 664 (284) (23 793) 4 (22 775) 2 (22 398) 78 (12 588)
100 000 60 000 60 000
28 000
56 000 Projection Projection Profit/(loss) for the year 34 082 (136) (93 396) (278) 52 359 8 48 441 6 45 502 61 28 238
56 000 Budget 28 000 28 000
-4 000
12 000 Budget 29 632
12 000 Budget Other comprehensive income – – – – –
-4 000 -36 000 Projection
-4 000
-32 000
-32 000 Budget Budget Total comprehensive income/(loss) 34 082 (153) (63 764) (222) 52 359 8 48 441 6 45 502 61 28 238
-36 000 Projection -36 000 Projection
-68 000
-76 000
-76 000 Dividend declared – 17 500 9 16 100 9 14 800 56 9 467
-68 000 -100 000
-68 000
-120 000 2015 2016 2017 2018 2019 2020 2021 2022
-120 000 2015 2016 2017 2018 2019 2020 2021 2022
2015 2016 2017 2018 2019 2020 2021 2022 -100 000 -100 000 EBITDA ratio
2015 2016 2017 2018 2019 2020 2021 2022 2015 2016 2017 2018 2019 2020 2021 2022
Total long-term liabilities (excluding deferred tax liability) 324 565 83 177 098 (3) 182 489 45 125 647 3 122 123
Earnings before interest and taxation (EBIT) showed a 219% The company’s net profitability decreased dramatically following Total number of issued shares remained at 66 357. Due to the Ratio to total EBITDA (3.90) (352) 1.55 (19) 1.90 44 1.32 (28) 1.84
decrease on 2019. the Covid-19 pandemic. loss as a result of the pandemic, the earning per share decreased
from 2019. Note: % year-on-year increase or (decrease).
74 VALUE CREATION REPORT 2020 GONDWANA COLLECTION NAMIBIA 75